I'll never forget the afternoon our largest client called in a panic. Their conversion rate had plummeted 15% overnight, and the entire team was convinced their checkout flow was broken. Three days of debugging later, we discovered the real culprit: customers were *adding items to cart* with the same frequency, but they were abandoning at a completely different stage than before. A single CSS change from their dev team had made the "continue shopping" button slightly more prominent than the "proceed to checkout" button. Nobody was looking at the behavioral data—they were just staring at aggregate metrics. That's when I realized most e-commerce teams are flying blind, drowning in data but starving for actual insight.
This is the paradox of customer behavior analytics in e-commerce: we have more tracking capabilities than ever, yet most businesses still make decisions based on hunches or last quarter's trends.
The Forgotten Middle
Here's something you won't read in your typical analytics textbook: the most valuable behavioral insight isn't about your best customers or your worst ones—it's about the 40% in the middle. Your top 5% of customers will probably buy from you regardless. Your bottom 40% might never convert. But those people in the middle? The ones who visit twice a month, browse for 8-10 minutes, add items, but only convert every three months? *That's where the real opportunity lives.*
Most analytics dashboards are built to show you binary outcomes: converted or didn't convert. What they don't show you is the *progression path*—the sequence of behaviors that actually leads to purchase. Does your customer typically view 4 products before buying, or 12? Do they visit your FAQ before checkout, or do they skip it? Do they compare prices across categories first? These micro-patterns compound, and when you map them across your customer base, they start telling a story that aggregate numbers completely obscure.
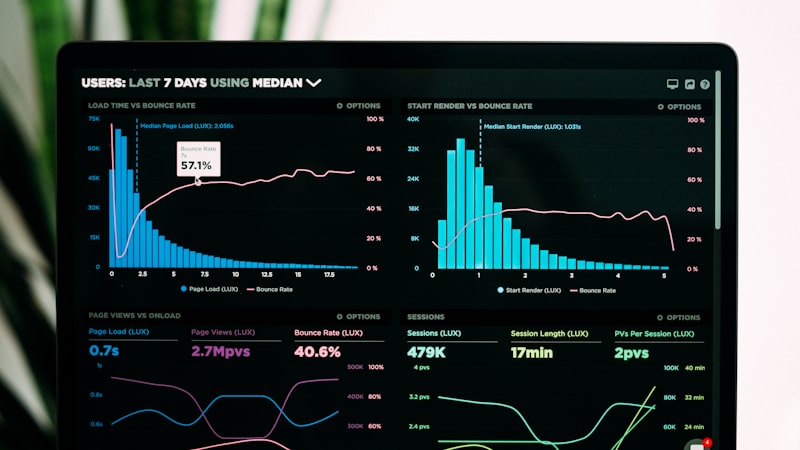
In Vietnam's e-commerce market specifically, this matters even more. The conversion funnel is different here than in Western markets. Vietnamese customers tend to spend longer in the consideration phase, often visiting multiple times before committing. We've seen bounce rates that look "high" on paper (40-50%) but are actually completely normal when you understand the shopping behavior pattern. The mistake is applying global benchmarks when your actual customer journey looks entirely different.
The Tool Problem (Yes, You Probably Have Too Many)
Share this post
Related Posts
Need technology consulting?
The Idflow team is always ready to support your digital transformation journey.
I've worked with companies using anywhere from 2 to 15 different analytics tools simultaneously. Google Analytics, Mixpanel, Amplitude, custom event tracking, heat mapping software, session recording platforms—and somehow they're *still* asking basic questions about customer behavior that should take 10 minutes to answer.
Here's my unpopular opinion: more tools don't solve the insight problem; they usually create it. You end up with conflicting numbers (Google says 50,000 users, Mixpanel says 48,000 who actually engaged), duplicate tracking logic that drifts out of sync, and analysts spending 60% of their time reconciling data from different platforms instead of actually analyzing it.
The companies that get customer behavior analytics *right* have usually consolidated on 2-3 platforms maximum. Google Analytics for your traffic baseline (it's free, it's adequate), one behavioral analytics platform like Amplitude or Mixpanel for actual *user action* tracking, and maybe a session recording tool like Hotjar or FullStory if you're serious about understanding drop-off points. That's it.
The real work isn't choosing software—it's defining what behaviors actually matter to your business. Do you care about time-on-page? Nobody does. Do you care about "users who viewed the sale section then returned within 7 days"? That's actually useful. Design your events around *business outcomes*, not marketing buzzwords, and suddenly the tools become less important than the data design.
The Segment Nobody Talks About
Here's a specific insight that separates practitioners from people reading Medium articles: understand your high-frequency, low-value customer. These are users who visit your site 30+ times a month, interact with your platform constantly, but have a customer lifetime value of $20. Maybe they're comparison shopping obsessively. Maybe they're using your site as a free service without intent to buy. Maybe they're competitors doing market research.
Most teams either ignore these users completely or waste resources trying to convert them. The smarter approach is *segmentation-aware analysis*. Once you identify these patterns (and you can usually do this with four lines of SQL), you can filter them out of conversion analysis entirely. Suddenly your actual conversion metrics start making sense. We've worked with clients who discovered 12-15% of their traffic was this type of user, and their "actual" conversion rate was 40-50% higher than they thought.
The Vietnam Factor
Vietnamese e-commerce behavior has some distinct characteristics that generic analytics frameworks miss. Mobile-first shopping is more pronounced here—often 80%+ of traffic comes from mobile, but *purchase intent* from desktop is 2-3x higher. Your dashboard showing "200,000 daily users" isn't as valuable as knowing "95,000 of those are mobile browsers and only 12,000 will likely convert." The behavior analysis that matters is understanding these fundamental differences, not just looking at overall metrics.
Additionally, trust signals work differently. Vietnamese customers heavily influence each other through social validation. Customer reviews, ratings, and user-generated content drive significantly more repeat visits and conversion than they do in Western markets. If you're not analyzing *how* customers interact with review sections or how review sentiment correlates with repurchase rates, you're missing a massive behavioral driver specific to the market.
Making It Actionable
The final piece that most analytics implementations get wrong: connecting behavior to action. You can identify that customers who visit your FAQ convert 34% higher. Then what? Do you make the FAQ more discoverable? Change your product messaging? Reduce the need for FAQs by clarifying descriptions?
Real customer behavior analytics flows into experimentation. You don't just observe—you hypothesize and test. You notice that customers in your "lingering" segment spend 3 minutes on product pages without scrolling to reviews, so you hypothesis that above-the-fold review snippets might increase conversion. You run an A/B test. You measure the behavioral change.
This feedback loop—observe, hypothesize, experiment, measure—is where insights become competitive advantage.
---
If you're serious about understanding your customers beyond surface metrics, tools like Idflow Technology can help connect these behavioral insights into actionable product changes, but honestly, the harder work is thinking clearly about *which* behaviors matter for your specific business. The technology is just the enabler.